LeakCanary主要用来进行内存泄漏检测 ,并且可以直观的展示泄漏的路径
如何使用 1 2 3 4 dependencies {'com.squareup.leakcanary:leakcanary-android:2.5'
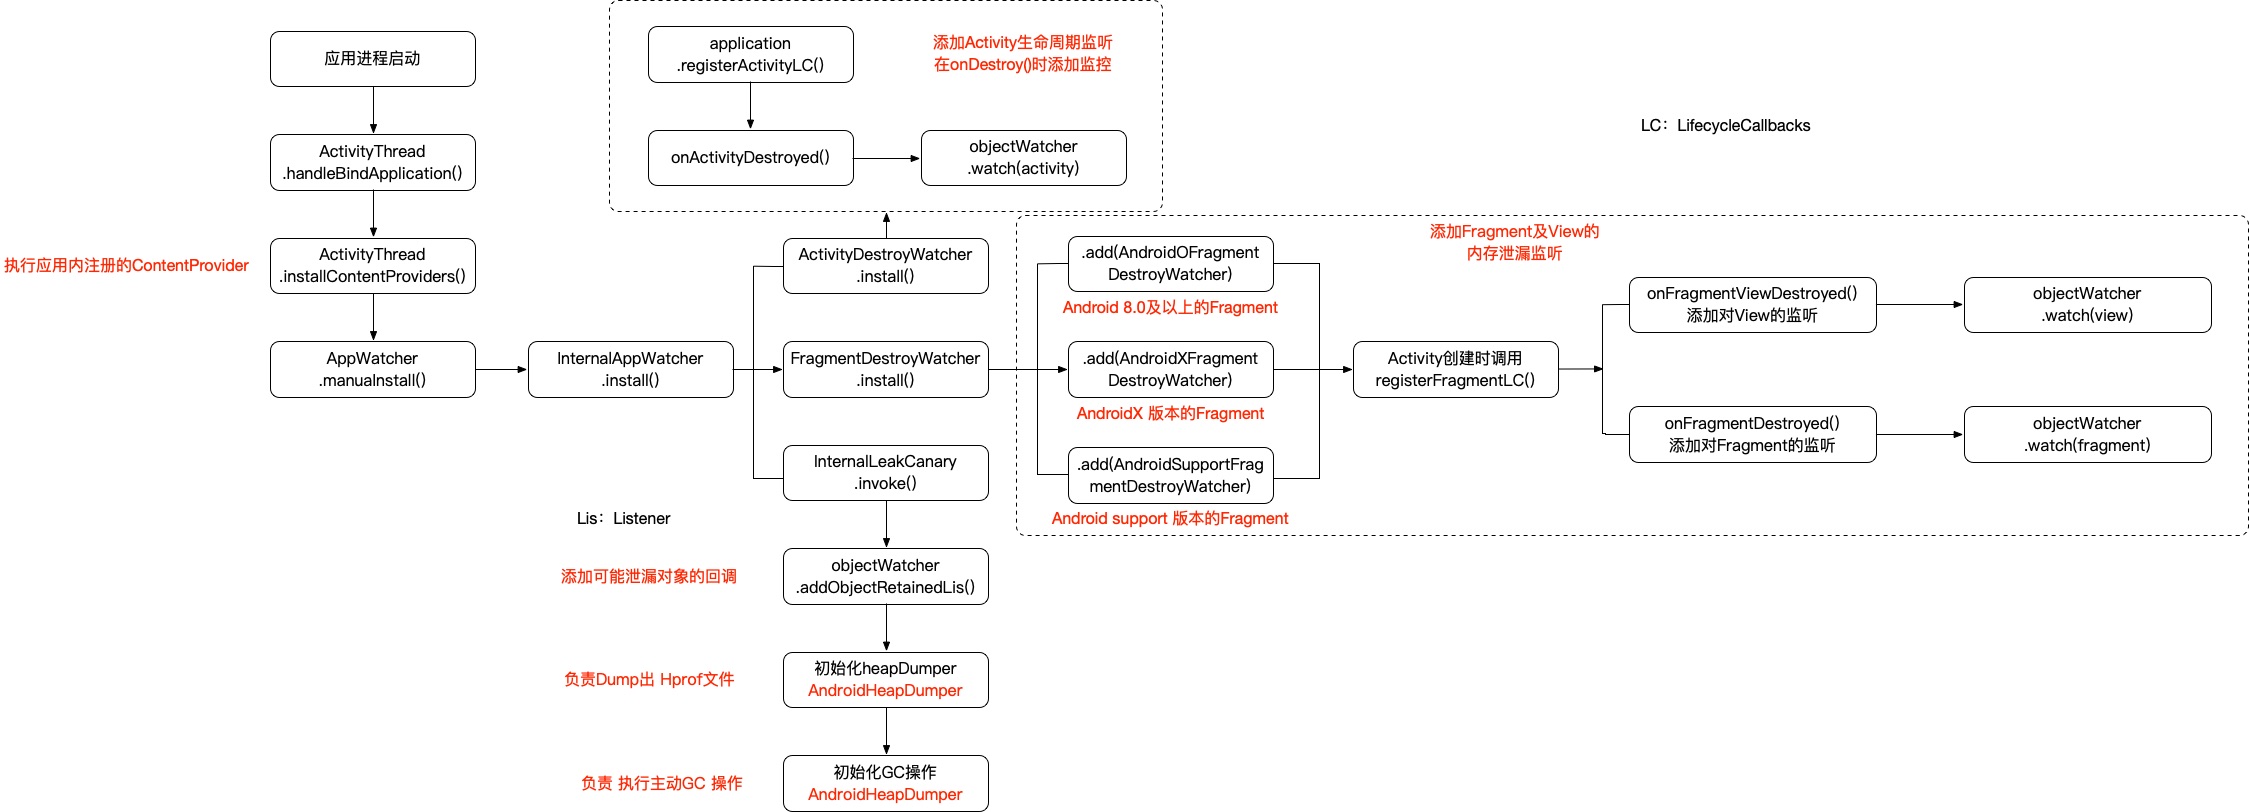
配置完成后,LeakCanary通过ContentProvider进行注册以及初始化。
1 2 3 4 5 6 7 8 9 10 internal sealed class AppWatcherInstaller : ContentProvider () {override fun onCreate () Boolean {val application = context!!.applicationContext as Applicationreturn true
涉及的部分Activity启动过程源码:
1 2 3 4 5 6 7 8 9 10 11 12 13 14 15 16 17 18 19 20 21 22 23 24 25 26 27 28 29 30 31 32 33 34 35 36 37 38 39 private void handleBindApplication (AppBindData data) {final ContextImpl appContext = ContextImpl.createAppContext(this , data.info);try {Application app = data.info.makeApplication(data.restrictedBackupMode, null );try {catch (Exception e) {throw new RuntimeException ("Exception thrown in onCreate() of " ": " + e.toString(), e);try {catch (Exception e) {if (!mInstrumentation.onException(app, e)) {throw new RuntimeException ("Unable to create application " + app.getClass().getName()": " + e.toString(), e);finally {
在handleBindApplication()进行ContentProvider的启动,此时AppWatcherInstaller会在此时启动。
向下调用到AppWatcher.manualInstall(application)
1 2 3 4 5 6 7 8 9 10 11 fun manualInstall (application: Application ) fun install (application: Application )
到此基本的LeakCanary初始化完毕
主动添加内存泄漏监控 1 AppWatcher.objectWatcher.watch(watchObject,reason)
源码解析 注册监听 在初始化过程执行的注册监听过程
1 2 3 4 5 6 7 8 9 10 11 12 13 14 15 16 17 fun install (application: Application ) if (this ::application.isInitialized) {return if (isDebuggableBuild) {val configProvider = { AppWatcher.config }
监听Activity ActivityDestroyWatcher.install
1 2 3 4 5 6 7 8 9 10 11 12 13 14 15 16 17 18 19 20 21 22 23 24 25 26 27 28 29 30 internal class ActivityDestroyWatcher private constructor (private val objectWatcher: ObjectWatcher,private val configProvider: () -> Configprivate val lifecycleCallbacks =object : Application.ActivityLifecycleCallbacks by noOpDelegate() {override fun onActivityDestroyed (activity: Activity ) if (configProvider().watchActivities) {"${activity::class.java.name} received Activity#onDestroy() callback" companion object {fun install ( application: Application , objectWatcher: ObjectWatcher , configProvider: () -> Config ) val activityDestroyWatcher =
主要是为了注册Activity的生命周期回调,监测到onActivityDestroyed()之后,将Activity加入到objectWatcher中
监听Fragment FragmentDestroyWatcher.install
1 2 3 4 5 6 7 8 9 10 11 12 13 14 15 16 17 18 19 20 21 22 23 24 25 26 27 28 29 30 31 32 33 34 35 36 37 38 39 40 41 42 43 44 45 46 47 48 49 50 51 52 53 54 55 56 57 58 59 60 61 62 63 64 65 66 67 68 69 70 internal object FragmentDestroyWatcher {private const val ANDROIDX_FRAGMENT_CLASS_NAME = "androidx.fragment.app.Fragment" private const val ANDROIDX_FRAGMENT_DESTROY_WATCHER_CLASS_NAME ="leakcanary.internal.AndroidXFragmentDestroyWatcher" private val ANDROID_SUPPORT_FRAGMENT_CLASS_NAME ="android." ).append("support.v4.app.Fragment" )private const val ANDROID_SUPPORT_FRAGMENT_DESTROY_WATCHER_CLASS_NAME ="leakcanary.internal.AndroidSupportFragmentDestroyWatcher" fun install ( application: Application , objectWatcher: ObjectWatcher , configProvider: () -> AppWatcher .Config ) val fragmentDestroyWatchers = mutableListOf<(Activity) -> Unit >()if (SDK_INT >= O) {if (fragmentDestroyWatchers.size == 0 ) {return object : Application.ActivityLifecycleCallbacks by noOpDelegate() {override fun onActivityCreated ( activity: Activity , savedInstanceState: Bundle ? ) for (watcher in fragmentDestroyWatchers) {
根据上述源码,FragmentDestroyWatcher按照三种情况进行区分:
Android O 及以上版本的fragment:AndroidOFragmentDestroyWatcher
AndroidX 的fragment:AndroidXFragmentDestroyWatcher
Android support 的 fragment:AndroidSupportFragmentDestroyWatcher
上述三种实现基本一致,只是对引用的fragment进行了区分,下面拿AndroidSupportFragmentDestroyWatcher进行分析
1 2 3 4 5 6 7 8 9 10 11 12 13 14 15 16 17 18 19 20 21 22 23 24 25 26 27 28 29 30 31 32 33 34 35 36 37 38 39 40 41 42 43 internal class AndroidSupportFragmentDestroyWatcher (private val objectWatcher: ObjectWatcher,private val configProvider: () -> ConfigUnit {private val fragmentLifecycleCallbacks = object : FragmentManager.FragmentLifecycleCallbacks() {override fun onFragmentViewDestroyed ( fm: FragmentManager , fragment: Fragment ) val view = fragment.viewif (view != null && configProvider().watchFragmentViews) {"${fragment::class.java.name} received Fragment#onDestroyView() callback " +"(references to its views should be cleared to prevent leaks)" override fun onFragmentDestroyed ( fm: FragmentManager , fragment: Fragment ) if (configProvider().watchFragments) {"${fragment::class.java.name} received Fragment#onDestroy() callback" override fun invoke (activity: Activity ) if (activity is FragmentActivity) {val supportFragmentManager = activity.supportFragmentManagertrue )
主要是在FragmentManager调用registerFragmentLifecycleCallbacks()添加生命周期监听。
在onFragmentViewDestroyed()添加View的监听
在onFragmentDestroyed()添加Fragment的监听
最后在registerActivityLifecycleCallbacks()的每个Activity的onActivityCreated()中执行Fragment的生命周期监听。
此时objectWatcher对象就已经监听到了如下实例:
Activity
Fragment
Fragment中的View
InternalLeakCanary 1 2 3 4 5 6 7 8 9 10 11 12 init {val internalLeakCanary = try {val leakCanaryListener = Class.forName("leakcanary.internal.InternalLeakCanary" )"INSTANCE" )get (null )catch (ignored: Throwable) {@kotlin .Suppress("UNCHECKED_CAST" )as (Application) -> Unit
最后执行的onAppWatcherInstalled()的实现类就是InternalLeakCanary
1 2 3 4 5 6 7 8 9 10 11 12 13 14 15 16 17 18 19 20 21 22 23 24 25 26 27 28 29 30 31 32 33 34 35 36 37 38 39 40 41 42 43 44 override fun invoke (application: Application ) this )val heapDumper = AndroidHeapDumper(application, createLeakDirectoryProvider(application))val gcTrigger = GcTrigger.Defaultval configProvider = { LeakCanary.config }val handlerThread = HandlerThread(LEAK_CANARY_THREAD_NAME)val backgroundHandler = Handler(handlerThread.looper)this .applicationVisible = applicationVisiblewhen (val iCanHasHeap = HeapDumpControl.iCanHasHeap()) {is Yup -> application.getString(R.string.leak_canary_heap_dump_enabled_text)is Nope -> application.getString(
InternalLeakCanary主要负责接收objectWatcher通知的可能存在的内存泄漏消息并驱动heapDumpTrigger进行Dump过程。
得到最终产出的Hprof文件去进行分析的流程。
泄漏检测 根据上节分析可知,所有需要监控的对象都会通过objectWatcher.watch()进行对象监听
1 2 3 4 5 6 7 8 9 10 11 12 13 val watchDurationMillis: Long = TimeUnit.SECONDS.toMillis(5 ),private val checkRetainedExecutor = Executor {val objectWatcher = ObjectWatcher(true }
实现类是ObjectWatcher
ObjectWatcher 1 2 3 4 5 6 7 8 9 10 11 12 13 14 15 16 17 18 19 20 21 22 23 24 25 26 27 28 29 30 31 32 33 34 35 36 37 class ObjectWatcher constructor (private val clock: Clock,private val checkRetainedExecutor: Executor,private val isEnabled: () -> Boolean = { true }private val watchedObjects = mutableMapOf<String, KeyedWeakReference>()private val queue = ReferenceQueue<Any>()@Synchronized fun watch ( watchedObject: Any , description: String ) if (!isEnabled()) {return val key = UUID.randomUUID()val watchUptimeMillis = clock.uptimeMillis()val reference =
调用watch()之后,将需要监听的对象添加弱引用(WeakReference),再通过关联一个引用队列(ReferenceQueue)判断监听对象是否被回收。
为什么选用弱引用?
除了强引用不会被回收外,还存在着软引用和虚引用。其中软引用必须在内存将满时才会被回收并加入到ReferenceQueue中,而虚引用在加入到ReferenceQueue时,内置的引用无法被清空。
包装成弱引用对象后,执行checkRetainedExecutor的线程池,本质上执行的是等待5s后执行对象是否回收的判断。
1 2 3 4 5 6 7 8 9 10 11 12 13 14 15 16 17 18 19 20 @Synchronized private fun moveToRetained (key: String ) val retainedRef = watchedObjects[key]if (retainedRef != null ) {private fun removeWeaklyReachableObjects () var ref: KeyedWeakReference?do {as KeyedWeakReference?if (ref != null ) {while (ref != null )
watchedObjects存放的就是被观察的对象引用,每次调用watch()都会发送一个延时5s的消息。
延时消息主要执行moveToRetained(),内部主要执行如下过程:
遍历queue(引用队列),将其中存在的对象从watchedObjects中移除,因为已经被回收
如果对象没有从watchedObjects中移除,就表示该对象发生了内存泄漏
Dump出Hprof文件 如果存在未被回收的对象,此时就会回调到OnObjectRetainedListener.onObjectRetained()
1 2 3 4 5 6 7 8 9 10 11 12 13 14 15 16 17 18 19 internal object InternalLeakCanary : (Application) -> Unit , OnObjectRetainedListener {override fun invoke (application: Application ) this )override fun onObjectRetained () fun scheduleRetainedObjectCheck () if (this ::heapDumpTrigger.isInitialized) {
切换到HeapDumpTrigger继续执行
HeapDumpTrigger 1 2 3 4 5 6 7 8 9 10 11 12 13 14 15 16 17 18 19 20 21 22 23 24 25 26 27 28 29 30 31 32 33 34 35 36 37 38 39 40 41 42 43 44 45 46 47 48 49 50 51 52 53 54 fun scheduleRetainedObjectCheck ( delayMillis: Long = 0 L ) val checkCurrentlyScheduledAt = checkScheduledAtif (checkCurrentlyScheduledAt > 0 ) {return 0 private fun checkRetainedObjects () var retainedReferenceCount = objectWatcher.retainedObjectCountif (retainedReferenceCount > 0 ) {if (checkRetainedCount(retainedReferenceCount, config.retainedVisibleThreshold)) return true )object Default : GcTrigger {override fun runGc () private fun enqueueReferences () try {100 )catch (e: InterruptedException) {throw AssertionError()
scheduleRetainedObjectCheck()并不是直接去dump,而是先手动调用一次GC,然后再触发GC后等待100ms之后再去检测一次是否有对象未被回收。
其中判断过程还添加了阈值(5),避免频繁触发dumpHeap()导致卡顿。
dumpHeap() 主要负责dump 出 Hprof文件
1 2 3 4 5 6 7 8 9 10 11 12 13 14 15 16 17 18 19 20 21 22 23 24 25 26 27 28 29 30 val heapDumper = AndroidHeapDumper(application, createLeakDirectoryProvider(application))private fun dumpHeap ( retainedReferenceCount: Int , retry: Boolean ) val heapDumpUptimeMillis = SystemClock.uptimeMillis()when (val heapDumpResult = heapDumper.dumpHeap()) {is NoHeapDump -> {is HeapDump -> {0
通过AndroidHeapDumper去执行dump过程
1 2 3 4 5 6 7 8 9 10 11 12 13 14 15 16 17 18 19 20 21 22 23 24 override fun dumpHeap () return try {val durationMillis = measureDurationMillis {if (heapDumpFile.length() == 0L ) {"Dumped heap file is 0 byte length" }else {catch (e: Exception) {"Could not dump heap" }finally {
主要是执行Debug.dumpHprofData()得到Hprof文件去进行内存分析。
HeapAnalyzerService.runAnalysis() 主要负责去分析Hprof文件
1 2 3 4 5 6 7 8 9 10 11 12 13 14 fun runAnalysis ( context: Context , heapDumpFile: File , heapDumpDurationMillis: Long ? = null ) val intent = Intent(context, HeapAnalyzerService::class .java)
接下来切换到HeapAnalyzerService开始进行Hprof文件解析流程。
Hprof解析 在HeapAnalyzerService收到传过来的Hprof文件地址后,就要开始解析
1 2 3 4 5 6 7 8 9 10 11 12 13 14 15 16 17 18 19 20 21 22 23 private fun analyzeHeap ( heapDumpFile: File , config: Config ) val heapAnalyzer = HeapAnalyzer(this )val proguardMappingReader = try {open (PROGUARD_MAPPING_FILE_NAME))catch (e: IOException) {null return heapAnalyzer.analyze(
解析前需要了解一下Hprof结构 ,在此基础上进行Hprof解析的相关流程分析。
简单说明一下Hprof的相关结构
主要分为两部分:
Header:主要包含一些元信息,例如文件协议的版本、开始和结束的时间戳,以及标识符大小
Record:主要结构为TAG、TIME、LENGTH(BODY数据长度)和BODY
TAG:表示Record类型,重要的有HEAP_DUMP_SEGMENT和STRING等
Shark.HeapAnalyzer
Shark是一款分析Hprof文件的工具,性能高且占用内存少,非常适合手机端的Hprof文件解析功能。
目的是提供快速解析Hprof文件和分析的能力。
1 2 3 4 5 6 7 8 9 10 11 12 13 14 15 16 17 18 19 20 21 22 23 24 25 26 27 28 fun analyze ( heapDumpFile: File , leakingObjectFinder: LeakingObjectFinder , referenceMatchers: List <ReferenceMatcher > = emptyList() Boolean = false ,null return try {val sourceProvider = ConstantMemoryMetricsDualSourceProvider(FileSourceProvider(heapDumpFile))val helpers =val result = helpers.analyzeGraph("Stats" to stats))catch (exception: Throwable) {
openHeapGraph 主要用来按照格式解析Hprof文件
1 2 3 4 5 6 7 8 9 10 11 12 13 14 15 16 17 18 19 20 21 22 23 24 25 26 27 fun DualSourceProvider.openHeapGraph ( proguardMapping: ProguardMapping ? = null , indexedGcRootTypes: Set <HprofRecordTag > = HprofIndex.defaultIndexedGcRootTags() val header = openStreamingSource().use { HprofHeader.parseHeaderOf(it) }val index = HprofIndex.indexRecordsOf(this , header, proguardMapping, indexedGcRootTypes)return index.openHeapGraph()fun indexRecordsOf ( hprofSourceProvider: DualSourceProvider , hprofHeader: HprofHeader , proguardMapping: ProguardMapping ? = null , indexedGcRootTags: Set <HprofRecordTag > = defaultIndexedGcRootTags() val reader = StreamingHprofReader.readerFor(hprofSourceProvider, hprofHeader)val index = HprofInMemoryIndex.indexHprof(return HprofIndex(hprofSourceProvider, hprofHeader, index)
将Hprof中的Record解析成HprofMemoryIndex,将Record按照Tag进行分析和计数,并通过特定规则进行排序。
最终通过openHeapGraph()组合得到HprofHeapGraph对象,等价于Hprof文件转换成了HprofHeapGraph对象。
1 2 3 4 5 6 7 8 9 10 11 12 13 14 15 16 17 18 19 20 21 22 23 class HprofHeapGraph internal constructor (private val header: HprofHeader,private val reader: RandomAccessHprofReader,private val index: HprofInMemoryIndexoverride val gcRoots: List<GcRoot>get () = index.gcRoots()override val objects: Sequence<HeapObject>override val classes: Sequence<HeapClass>override val instances: Sequence<HeapInstance>
内部主要包括了gcRoots、objects、classes和instances几种集合,可以快速定位dump堆中的对象。
主要分析泄漏对象
1 2 3 4 5 6 7 8 9 10 11 12 13 14 15 16 17 18 19 20 21 fun analyze ( heapDumpFile: File , graph: HeapGraph , leakingObjectFinder: LeakingObjectFinder , referenceMatchers: List <ReferenceMatcher > = emptyList() Boolean = false ,return try {val helpers =catch (exception: Throwable) {
接下来执行到analyzeGraph
1 2 3 4 5 6 7 8 9 10 11 12 13 14 15 16 17 18 19 20 21 22 23 24 25 26 27 28 29 30 31 32 33 34 35 private fun FindLeakInput.analyzeGraph ( metadataExtractor: MetadataExtractor , leakingObjectFinder: LeakingObjectFinder , heapDumpFile: File , analysisStartNanoTime: Long ) val metadata = metadataExtractor.extractMetadata(graph)val leakingObjectIds = leakingObjectFinder.findLeakingObjectIds(graph)val (applicationLeaks, libraryLeaks) = findLeaks(leakingObjectIds)return HeapAnalysisSuccess(private fun FindLeakInput.findLeaks (leakingObjectIds: Set <Long >) val pathFinder = PathFinder(graph, listener, referenceMatchers)val pathFindingResults =val shortestPaths =val inspectedObjectsByPath = inspectObjects(shortestPaths)return buildLeakTraces(shortestPaths, inspectedObjectsByPath, retainedSizes)
主要执行流程分为3步:
findLeakingObjectIds
寻找泄漏的对象
设置的leakingObjectFinder实际就是KeyedWeakReferenceFinder
1 2 3 4 5 6 7 8 9 10 11 12 13 14 15 16 17 18 19 20 21 22 23 24 25 26 27 28 29 30 override fun findLeakingObjectIds (graph: HeapGraph ) Long > =internal fun findKeyedWeakReferences (graph: HeapGraph ) return graph.context.getOrPut(KEYED_WEAK_REFERENCE.name) {val keyedWeakReferenceClass = graph.findClassByName("leakcanary.KeyedWeakReference" )val keyedWeakReferenceClassId = keyedWeakReferenceClass?.objectId ?: 0 val legacyKeyedWeakReferenceClassId ="com.squareup.leakcanary.KeyedWeakReference" )?.objectId ?: 0 val heapDumpUptimeMillis = heapDumpUptimeMillis(graph)val addedToContext: List<KeyedWeakReferenceMirror> = graph.instances
主要就是实现了 找寻instance实例中的被KeyedWeakReference所包装的实例,因为在最前面watch的过程中,需要监控的对象都是被KeyedWeakReference所包装的,既然能在isntance中找到就意味着这些对象是发生了内存泄漏的。
findPathsFromGcRoots
寻找泄漏对象到GC Roots对象的引用路径
1 2 3 4 5 6 7 8 9 10 11 12 13 14 15 16 17 18 19 20 21 22 23 24 25 26 27 28 29 30 31 32 33 34 35 36 37 38 39 40 41 42 43 44 45 46 47 fun findPathsFromGcRoots ( leakingObjectIds: Set <Long >, computeRetainedHeapSize: Boolean ) val state = State(return state.findPathsFromGcRoots()private fun State.findPathsFromGcRoots () val shortestPathsToLeakingObjects = mutableListOf<ReferencePathNode>()visitingQueue@ while (queuesNotEmpty) {val node = poll()if (node.objectId in leakingObjectIds) {if (shortestPathsToLeakingObjects.size == leakingObjectIds.size()) {if (computeRetainedHeapSize) {else {break @visitingQueue when (val heapObject = graph.findObjectById(node.objectId)) {is HeapClass -> visitClassRecord(heapObject, node)is HeapInstance -> visitInstance(heapObject, node)is HeapObjectArray -> visitObjectArray(heapObject, node)return PathFindingResults(if (visitTracker is Dominated) visitTracker.dominatorTree else null
总体思路
采用广度优先遍历 从GC Roots开始遍历,直到泄漏对象为止。
广度优先遍历:从根节点出发,沿着树宽度依此遍历树的每个节点。借助队列结构实现
以GC Roots对象为树的根节点,然后从根节点开始遍历,对每个节点依据类型的不同采取对应的模式进行访问并得到对象,然后引用继续抽象成为Node加入队列以待后续遍历,直到遍历到Node为leakObjectId,期间经过的所有Node对象连在一起就是一次完整的引用路径。
最终得到的就是泄漏对象 到 GC Roots对象的引用路径。
deduplicateShortestPaths
根据多条引用路径,进行裁剪得到最短的引用路径
1 2 3 4 5 6 7 8 9 10 11 12 13 14 15 16 17 18 19 20 21 22 23 24 25 26 27 28 29 30 31 32 33 34 35 36 37 38 39 40 41 42 private fun deduplicateShortestPaths ( inputPathResults: List <ReferencePathNode > ) val rootTrieNode = ParentNode(0 )val path = mutableListOf<Long >()var leakNode: ReferencePathNode = pathNodewhile (leakNode is ChildNode) {0 , leakNode.objectId)0 , leakNode.objectId)0 , rootTrieNode)private fun updateTrie ( pathNode: ReferencePathNode , path: List <Long >, pathIndex: Int , parentNode: ParentNode ) val objectId = path[pathIndex]if (pathIndex == path.lastIndex) {else {val childNode = parentNode.children[objectId] ?: {val newChildNode = ParentNode(objectId)if (childNode is ParentNode) {1 , childNode)
总体思路:
一个对象被很多对象引用是很正常的行为,所以泄漏对象和GC Roots对象之间可能存在多条引用路径,此时就需要进行裁剪得到最短的引用路径方便分析。
将路径反转成为GC Roots对象 到 泄漏对象的的引用路径,然后通过updateTrie()转化成为无效Node为根节点的树,最后经过深度优先遍历得到从根节点到叶子节点的所有路径,即为最终的最短引用路径。
深度优先遍历:从树的根节点开始,先遍历左子树再遍历右子树。借助栈结构实现 。
buildLeakTraces
建立泄漏路径
1 2 3 4 5 6 7 8 9 10 11 12 13 14 15 16 17 18 19 20 21 22 23 24 25 26 27 28 29 30 31 32 33 34 35 36 37 38 39 40 private fun buildLeakTraces ( shortestPaths: List <ShortestPath >, inspectedObjectsByPath: List <List <InspectedObject >>, retainedSizes: Map <Long , Pair<Int , Int >>? ) val inspectedObjects = inspectedObjectsByPath[pathIndex]val leakTraceObjects = buildLeakTraceObjects(inspectedObjects, retainedSizes)val referencePath = buildReferencePath(shortestPath.childPath, leakTraceObjects)val leakTrace = LeakTrace(val firstLibraryLeakNode = if (shortestPath.root is LibraryLeakNode) {else {is LibraryLeakNode } as LibraryLeakNode?if (firstLibraryLeakNode != null ) {val matcher = firstLibraryLeakNode.matcherval signature: String = matcher.pattern.toString()else {
最终构建得到ApplicationLeak和LibraryLeak,组装得到HeapAnalysis
1 2 3 4 5 6 7 8 9 10 11 12 13 14 15 16 17 18 19 20 21 22 23 24 25 26 27 28 override fun onHandleIntentInForeground (intent: Intent ?) if (intent == null || !intent.hasExtra(HEAPDUMP_FILE_EXTRA)) {"HeapAnalyzerService received a null or empty intent, ignoring." }return val heapDumpFile = intent.getSerializableExtra(HEAPDUMP_FILE_EXTRA) as Fileval heapDumpDurationMillis = intent.getLongExtra(HEAPDUMP_DURATION_MILLIS, -1 )val config = LeakCanary.configval heapAnalysis = if (heapDumpFile.exists()) {else {val fullHeapAnalysis = when (heapAnalysis) {is HeapAnalysisSuccess -> heapAnalysis.copy(dumpDurationMillis = heapDumpDurationMillis)is HeapAnalysisFailure -> heapAnalysis.copy(dumpDurationMillis = heapDumpDurationMillis)
解析完成后,回调到onHeapAnalyzedListener中的onHeapAnalyzed().
其中config 配置的onHeapAnalyzedListener为DefaultOnHeapAnalyzedListener
1 2 3 4 5 6 7 8 9 10 11 12 13 14 15 16 17 18 19 20 21 22 23 24 25 override fun onHeapAnalyzed (heapAnalysis: HeapAnalysis ) "\u200B\n${LeakTraceWrapper.wrap(heapAnalysis.toString(), 120 )} " }val id = LeaksDbHelper(application).writableDatabase.use { db ->val (contentTitle, screenToShow) = when (heapAnalysis) {is HeapAnalysisFailure -> application.getString(is HeapAnalysisSuccess -> {val retainedObjectCount = heapAnalysis.allLeaks.sumBy { it.leakTraces.size }val leakTypeCount = heapAnalysis.applicationLeaks.size + heapAnalysis.libraryLeaks.size
总结 1.LeakCanary整套流程从注册监听Activity/Fragment对象生命周期开始,当对应组件销毁时添加对应组件的观察。
在onActivityDestroyed()添加对Activity的观察
在onFragmentViewDestroyed()添加对Fragment中的View的观察
在onFragmentDestroyed()添加对Fragment的观察
可以通过AppWatcher.objectWatcher.watch(XX)添加自定义对象的观察。
2.在泄漏检测时,通过WeakRefrence包装被观察的对象,然后等待5s 后,检查与WeakReference绑定的ReferenceQueue中是否包含被观察对象,若包含表示被观察对象已被回收;否则,判断对象可能泄漏。5s并不一定是执行了GC,只是一个估值,一般都会触发GC。
3.在准备DumpHeap前,还会再去手动执行一次GC,等待100ms 后如果还存在泄漏对象,就需要准备dump内存数据。此时有一个阈值,如果泄漏对象超过5个 ,才会去dump,避免频繁执行dump流程。
4.通过执行Debug.dumpHprofData()去生成Hprof文件,等待Hprof文件生成后,发送到HeapAnalyzerService去处理该文件。
5.HeapAnalyzerService收到Hprof文件后,通过Shark 对文件进行解析,按照Hprof文件格式进行解析,解析得到HprofHeapGraph对象,内部包含gcRoots、instances、classes、objects等集合,可以快速定位泄漏对象。
6.得到HprofHeapGraph对象后,开始分析内存泄漏的最短路径。内存泄漏的对象仍然与GC Roots对象保持可达的引用路径,导致GC无法释放。——一般用的都是可达性分析 。
寻找内存泄漏对象:在instances集合中寻找instanceClassId为KeyedWeakReferences的对象,这些就是前面所观察的对象。寻找所有内存泄漏对象与GC Roots对象的引用路径:采用广度优先遍历,从Gc Roots对象开始遍历到内存泄漏对象的所有引用路径裁剪所有路径得到 最短引用路径:采用深度优先遍历,得到内存泄漏对象到GC Roots对象的最短引用路径通知内存泄漏检测完毕:将最短引用路径包装成LeakTrace,按照是否为应用自身导致的内存泄漏 分为两个对象:ApplicationLeak和LibraryLeak。
参考链接 LeakCanary Wiki
LeakCanary解析